Powered by Deep Neural Networks
Better Than Telegram Copy Trade Bots
127 traders online now

Best Crypto Trading Bot 2026
Free Crypto Data Terminal for Binance Futures

CryptOn Alpha combines a free crypto data terminal with 20+ real-time tools and a non-custodial AI trading bot for Binance Futures. Access live liquidation heatmaps, whale tracking, on-chain analytics, and more – all free, no upfront fees. Your funds stay in your wallet, always.

Every terminal feature is free
No withdrawal access
Building and optimizing since 2022
5-7%
Avg Monthly Return*
24/7
Automated Trading
$7.6M+
Trading Volume

Past performance is not a guarantee of future results. Returns may vary.

Non-custodial
No withdrawal access
Running since 2022
Active subscribers

Live Performance

Live
Total Trading Volume
$7,600,635
Verified Binance Futures volume
ROI Performance (167 Days)
+28.19%
Avg 6.64% monthly return
Win Rate
99.12%
Based on last 167 days of trading

These results reflect past performance and are not guaranteed. Trading involves risk.

30+ Free Tools - All In One Place

What do you want to explore?

Jump directly to any tool, external app, or support page. Everything is free, no signup required.

Alpha Indicator
13+ signals, 3 timeframes
Free
Pulse Terminal
Live market overview dashboard
Free
Market Regime Radar
Risk zone detection
Free
Momentum Meter
Real-time trend strength
Free
BTC Price Forecast
1H / 4H / 24H probability zones
Free
Funding Rates
Live futures funding tracker
Free
Long/Short Ratio
Crowd positioning data
Free
CVD Chart
Cumulative volume delta
Free
Order Book Depth
Buy/sell wall visualization
Free
Liquidation Heatmap
Leverage cluster zones
Free
Options Flow
Institutional options activity
Free
Whale Tracker
Large BTC wallet movements
Free
ETF Flows
BlackRock, Fidelity, Grayscale
Free
Exchange Netflow
Exchange deposit/withdrawal
Free
On-Chain Analytics
SOPR, NUPL, MVRV & more
Free
On-Chain Heatmaps
Realized price heatmaps
Free
Halving Cycle
Countdown & cycle tracker
Free
Rainbow Chart
BTC valuation bands
Free
Social Sentiment
Trending coins & narratives
Free
BTC Dominance
Alt season indicator
Free
Volume Spike Scanner
Breakout pre-detection
Free
Technical Screener
40+ pairs multi-timeframe
Free
Correlation Matrix
Cross-asset correlations
Free
Token Unlocks
Upcoming supply events
Free
Portfolio Tracker
PnL simulator & tracker
Free
Live News Feed
Real-time crypto news
Free
AI Trading Bot
Binance Futures, 24/7
Bot
Performance
99%+ win rate, live results
Live
Pricing Plans
No upfront fees
Bot
Live Trades
Real-time position feed
Bot
DEX Sniper
On-chain fast entry tool
Tool
Strategy Marketplace
Browse & share strategies
Tool
Market Replay
Replay historical markets
Tool
NL Trading
Trade with plain language
Tool
AI Co-Pilot
AI-assisted trade insights
Tool
Nerve Center
Centralized control panel
Tool
FAQ
Frequently asked questions
Support
Contact Us
Telegram, email & support
Support

Showing all 40 tools

Real-Time Signal Engine

CryptOn Alpha Indicator

Our proprietary composite signal for Bitcoin. 13 indicators across 3 timeframes, weighted and scored in real-time. No account needed.

BTC / USDT
Loading...
Live
...
Calculating
out of 100
Strong SellSellNeutralBuyStrong Buy
Alpha Verdict
Analyzing market...
BTC Price + Alpha Score (30 Days)
Price Alpha
Loading 30-day history...
1H Timeframe
...
PRIMARY
4H Timeframe
...
1D Timeframe
...
Score Weighting
1H Indicators20%
4H Indicators (Primary)50%
1D Indicators20%
On-chain / Sentiment10%
Data Sources
Price + VolumeBinance Spot API
Funding RateBinance Futures
Long/Short RatioBinance Futures
Open InterestBinance Futures

Updates every 5 minutes  |  Not financial advice

Found this useful? Share with someone who trades crypto:

What if these signals traded automatically for you?

CryptOn's AI bot uses the same indicators to open and close trades 24/7 on your Binance account. You just watch the profits.

See How It Works
Free Crypto Data Terminal

Free Crypto Data Terminal

Free crypto data terminal with institutional-grade market intelligence. Real-time prices, funding rates, open interest, dominance, volume heatmaps, and breaking news. The data that Bloomberg charges $300K/year for - now free on CryptOn.

Loading live market data...
Overview
Derivatives
Analytics
Heatmap
News Feed
Live
Top Gainers (24H)
Loading...
Top Losers (24H)
Loading...
Top Volume (24H)
Loading...
Global Market
Total Market Cap
··
24H Volume
··
BTC Dominance
··
Active Cryptos
··
Dominance Distribution
Market Sentiment
··
Fear & Greed Index
Extreme FearExtreme Greed
BTC 24H High
··
BTC 24H Low
··
24H Liquidations
Total Liquidated
··
Longs Liquidated
··
Shorts Liquidated
··
Largest Single Liq
··
Top Liquidated Coins
Loading...

Data: Binance API · CoinGecko · Alternative.me  |  Auto-refreshes every 60 seconds

Structural Risk Detection

Market Regime Radar

Like upgrading from a basic weather app to a professional storm radar. Detects bearish pressure early, confirms bullish reversals reliably, and ignores short-term noise to focus on real structural momentum shifts.

🟢 LOW RISK
⚪ CAUTION
🔴 DEFENSIVE
···
Current Zone
···
Regime Score
···
Days in Zone
···
Max Drawdown Avoided

Regime Status

Live
DEFENSIVE
Ultra-bearish, further downside expected
30-Day Regime History
30d agoToday
Key Regime Signals
BTC Price + Regime Zones (60 Days)
Green Caution Defensive Price
Loading regime data...
Recent Regime Shifts
Early Detection

Regime Radar detects bearish price pressure earlier than traditional indicators. It identified the exit signal before the October crypto crash.

Noise Reduction

Ignores short-term market noise and focuses on real structural momentum shifts. Fewer false alarms mean fewer emotional trades.

Drawdown Protection

Redesigned to reduce large drawdowns during regime shifts. Risk zones turn defensive before major sell-offs, protecting your capital.

Updates every 15 minutes  |  This is informational only, not financial advice

Bitcoin Momentum

Is Bitcoin trending up or down right now? This gauge combines 7 technical indicators to give you a clear answer.

BTC / USDT

Live
··
Loading...
Strongly Bearish Neutral Strongly Bullish

Indicator Breakdown

4H Timeframe
Fetching market data...
Last updated ··
Source Binance API (4H candles)

Auto-refreshes every 5 minutes  |  This is informational only, not financial advice

Quant-Grade Price Forecasting

BTC Price Zone Forecast

Real-time statistical probability distribution of where Bitcoin is likely to trade over the next 1H, 4H, and 24H - powered by live Binance volatility data, ATR, and momentum-adjusted log-normal distribution. The same model institutional quant desks use.

BTC Price
···
···
24H Volatility
···
Annualised σ
Bias
···
Momentum-adjusted
Updated
···
Refreshes every 5m

BTC 1H Probability Zone Distribution

Live
Bullish zone Neutral zone Bearish zone Current price
Calculating probability zones...
Bearish Target
···
P(5%)
Bear Zone
···
P(25%)
Current Price
···
Live
Bull Zone
···
P(75%)
Bullish Target
···
P(95%)

Calculating distribution...

Zone Price Range Probability Distribution Signal
Building probability table...
How It Works

Uses live Binance ATR (14-period) and 24H realized volatility to build a momentum-adjusted log-normal distribution. The resulting probability curve shows likely price zones for each timeframe.

How to Use It

High-probability zones (50–75%) identify realistic targets. The bias indicator (Bullish/Bearish/Neutral) reflects whether the distribution is skewed by current momentum, helping you plan entries and exits.

Risk Disclaimer

Statistical forecasts are probabilistic, not certain. Black swan events and sudden news can invalidate any model. Always use stop-losses and manage risk. This is not financial advice.

Binance API · ATR + Log-Normal Distribution  |  Auto-refreshes every 5 minutes  |  Statistical model, not financial advice

Derivatives Intelligence

Perpetual Funding Rate Monitor

Track real-time perpetual futures funding rates for BTC, ETH & SOL. Extreme funding often signals incoming reversals. When everyone is paying to stay long, the squeeze is near.

BTC
Bitcoin
Live
Current Funding Rate
···
Annualized: ···
Next funding ··:··:··
ETH
Ethereum
Live
Current Funding Rate
···
Annualized: ···
Next funding ··:··:··
SOL
SOL
Solana
Live
Current Funding Rate
···
Annualized: ···
Next funding ··:··:··
Aggregate Funding Sentiment
Analyzing...
Calculating aggregate funding pressure
Avg Rate
··
Avg APR
··
Consensus
··
Funding Rate Analysis
Analyzing funding rate patterns across BTC, ETH, and SOL...
How Funding Works

Funding rates are periodic payments between long and short traders on perpetual futures. Positive rate = longs pay shorts (bullish crowding). Negative rate = shorts pay longs (bearish crowding). Extreme rates historically predict mean-reversion moves within 24-48 hours.

Data: Binance Futures Funding Rate API  |  Updates every 5 minutes · Countdown resets every 8 hours (00:00, 08:00, 16:00 UTC)

BTC Price vs Long/Short Ratio

When most traders go long, the market often reverses. Track how crowd positioning lines up with BTC price action.

BTC/USDT · 30 Day Overview

Live
BTC Price
Long Ratio
Short Ratio
Fetching 30-day data from Binance...
Current L/S
··
30D Avg
··
Peak Long
··
Peak Short
··

Analyzing correlation pattern...

Data: Binance Futures Top Trader L/S Ratio (Accounts)  |  Updates every 5 minutes

Order Flow Analysis

BTC Cumulative Volume Delta

Track real buying vs selling pressure on the top 3 exchanges. CVD divergence from price is one of the strongest reversal signals in crypto. Spot CVD rising while Futures CVD drops = smart money accumulating.

BTCUSDT · 1H CVD (24 Hours)

Live
BTC Price
Spot CVD
Futures CVD
Fetching Spot & Futures volume data from Binance...
BTC Price
··
Spot CVD 24H
··
Futures CVD 24H
··
Spot Trend
··
Divergence
··

Analyzing spot vs futures order flow divergence...

How To Read CVD

CVD tracks the net difference between aggressive buy vs sell volume. When Spot CVD rises but price falls, smart money is accumulating. When Futures CVD diverges from Spot, it often signals leveraged speculation vs real demand. Watch for Spot/Futures divergence as a powerful reversal signal.

How CryptOn Uses CVD

Our AI bot monitors CVD divergence between Spot and Futures in real-time as one of its 16+ indicators. When spot buyers are aggressive but futures sellers dominate, the bot identifies potential short squeeze setups. This order flow edge is built into every automated trade decision.

Data: Binance Spot & Futures Klines API  |  Updates every 5 minutes   

Market Microstructure

BTC Order Book Depth

Real-time buy & sell walls on Binance Futures. See where massive liquidity clusters sit, identify support/resistance zones, and spot potential price magnets before the crowd. Used by whales, market makers & pro traders.

BTC Price
··
Spread
··
Total Bids
··
Total Asks
··
Bid/Ask Ratio
··
Wall Bias
··

BTCUSDT Perpetual · Order Book Depth

Live
Bids (Buy)
Asks (Sell)
Cum. Bids
Cum. Asks
Fetching order book data from Binance Futures...
Buyers 50% / 50% Sellers
Largest Walls Detected
Side Price Level Size (BTC) Value (USD) Distance Strength
Loading wall data...

Scanning order book for large walls and liquidity clusters...

How To Read The Depth Chart

The depth chart shows cumulative buy/sell orders at each price level. Steep walls indicate massive liquidity clusters that may act as support or resistance. When price approaches a wall, it either bounces (wall holds) or breaks through (wall eaten). A higher Bid/Ask ratio suggests stronger buying pressure. Watch for walls appearing/disappearing - spoofing is common.

How CryptOn Uses Order Book Data

Our AI bot continuously scans order book depth across multiple exchanges to detect liquidity imbalances. When large buy walls appear near current price while sell-side is thin, it signals potential upward momentum. The bot uses this alongside 16+ other indicators to confirm entries with institutional-grade conviction.

Data: Binance Futures Order Book API (1000 levels, $100 buckets)  |  Updates every 10 seconds   

Pro-Level Data

Free Bitcoin Liquidation Heatmap Live

See where leveraged positions will get liquidated. Massive liquidation clusters act as price magnets. Know the levels before the market moves.

BTCUSDT Liquidation Levels

Live
Short Liquidations
Long Liquidations
Current Price
Calculating liquidation levels from Binance Futures data...
BTC Price
··
Open Interest
··
Nearest Long Liq
··
Nearest Short Liq
··
Liq Imbalance
··

Analyzing liquidation clusters...

How To Read This

Tall bars = large clusters of leveraged positions that will get forcefully closed if price reaches that level. These clusters act as liquidity magnets - market makers often push price toward them. Use this to anticipate potential price targets.

How CryptOn Uses This

Our AI bot monitors liquidation clusters in real-time as one of its 16+ indicators. It avoids entering positions near heavy liquidation zones and uses imbalance data to confirm trade direction. This edge is built into every automated trade.

Data: Binance Futures Open Interest  |  Updates every 5 minutes   

Onchain Position Data

Onchain Order Heatmaps

See where traders have set their Take Profit, Stop Loss orders and where Liquidations will cascade. Built from real open-position data - know where the crowd exits before price gets there.

BTCUSDT Take Profit Levels

Live
Long TPs (above price)
Short TPs (below price)
Current Price
Loading onchain position data...
BTC Price
··
Nearest Long TP
··
Nearest Short TP
··
Density Imbalance
··

Analyzing onchain position clusters...

Take Profit Heatmap

Shows price levels where open positions have take-profit orders clustered. Long TPs sit above price, short TPs below. Large clusters create price magnets - price is drawn to consume this liquidity.

Stop Loss Heatmap

Reveals where stop-loss orders are stacked. Long stops sit below price, short stops above. When price sweeps a stop cluster it can trigger a cascade move - a stop hunt followed by sharp reversal.

Liquidation Heatmap

Calculated from leveraged open interest - shows where forced liquidations trigger. Liquidation cascades can amplify moves dramatically. These levels often align with stop-loss clusters for a double liquidity sweep.

Calculated from Binance Futures Open Interest & Position Data  |  Updates every 5 minutes

Market Overview

Real-time sentiment, Bitcoin dominance, and all 12 trading pairs at a glance.

Crypto Fear & Greed
-- /100
Loading...
BTC Dominance
--%
Altcoin SeasonBTC Season
Loading...
24H Snapshot
BTC
-- --
ETH
-- --
BTC Volume --
Top Gainer --
Live Coin Heatmap 24H Change

Data from Binance API. Auto-refreshes every 5 minutes.

Free Crypto Whale Tracker

Free Crypto Whale Tracker Real Time

Monitor large BTC transactions in real-time. See where the big money is moving before the market reacts. Powered by Binance on-chain data.

Large Buys (24H)
--
--
Large Sells (24H)
--
--
Net Whale Flow
--
Accumulation vs Distribution
Whale Pressure
SellNeutralBuy
Live Whale Feed
Streaming
Scanning blockchain for whale activity...
Whale Sentiment
Analyzing...
Based on 24H large transaction flow
Top Whale Activity
Loading pairs...
Pro Tip: When whale buy volume exceeds sells by 2x+, price often follows within 2-4 hours. Our AI bot integrates this data automatically.
How To Read Whale Data

Large transactions (>$100K) from known exchange wallets signal institutional interest. Sudden buy clusters often precede bullish breakouts, while large sell walls can indicate distribution phases. Track the net flow direction for the strongest signal.

How CryptOn Uses Whale Data

Our AI bot monitors whale activity as one of its 16+ data inputs. It detects unusual accumulation patterns before entering positions and avoids trading against heavy whale distribution. This smart money tracking gives the bot an edge that purely technical bots can't match.

Data: Binance Spot & Futures aggregated trades  |  Live streaming   

Institutional Data

Bitcoin ETF Institutional Flows

Track daily inflows and outflows of major Bitcoin Spot ETFs. See where BlackRock, Fidelity, Grayscale and other institutional giants are moving billions.

Today's Net Flow
Loading...
--
7-Day Net Flow
Loading...
--
Top Inflow Today
--
--
Flow Pressure
OutflowNeutralInflow
Daily ETF Flow Breakdown
Daily
ETF Ticker Today's Flow AUM Flow
Loading ETF data...
30-Day Flow History
Loading chart...
Institutional Insight

Analyzing institutional flow patterns...

How To Read ETF Flows

Positive flows (green) mean institutions are buying Bitcoin through ETFs. Negative flows (red) mean they're selling. Consistent inflows from BlackRock's IBIT or Fidelity's FBTC often precede major BTC rallies, as institutional money tends to lead market direction.

How CryptOn Uses ETF Data

Our AI bot monitors institutional ETF flow patterns as a macro-level signal. Heavy institutional buying confirms bullish bias, while sustained outflows trigger cautious positioning. This smart money tracking helps the bot align trades with the biggest players in the market.

Data: SoSoValue / Farside Investors aggregated ETF reports  |  Updates daily (US market hours)   

Institutional-Grade Analytics

BTC Options Flow

Track Bitcoin options activity from Deribit, the world's largest crypto options exchange. See where institutional money is positioning through Put/Call ratios, max pain price, and open interest distribution.

Put/Call Ratio
--
Loading...
Max Pain Price
--
--
Total Call OI
--
--
Total Put OI
--
--
Open Interest by Strike
Live
Options Sentiment
Calls Puts
50% 50%
Analyzing options flow...
Nearest Expiries
Loading expiry data...
BTC Implied Volatility
7-Day IV
--
30-Day IV
--
How To Read Options Flow

A Put/Call ratio below 0.7 signals strong bullish positioning; above 1.0 indicates bearish hedging. The Max Pain price is where most options expire worthless, and BTC tends to gravitate toward it near expiry. High call OI at specific strikes shows where bulls are targeting, while put OI reveals key support levels.

How CryptOn Uses Options Data

Our AI integrates options flow as a contrarian and confirmation signal. When options sentiment diverges from spot market trends, it often signals a reversal. The bot monitors max pain levels as price magnets near expiry dates and adjusts position sizing when implied volatility spikes, indicating expected large moves.

Data: Deribit Options (via aggregated API)  |  Updates every 5 minutes   

On-Chain Intelligence

Exchange Netflow Tracker

Track BTC flowing in and out of major exchanges in real-time. When coins leave exchanges, it signals accumulation. When they enter, it warns of selling pressure. The #1 on-chain signal used by institutions.

24H Net Outflow
Loading...
--
7-Day Trend
Loading...
--
Exchange Reserve
--
Total BTC on Exchanges
Flow Signal
InflowNeutralOutflow
30-Day Exchange Netflow
Live
Loading netflow data...
Outflow (Bullish) Inflow (Bearish) BTC Price
Exchange Breakdown (24H)
Loading...
Signal: Analyzing exchange flow patterns...
How To Read Exchange Netflow

Net Outflow (Green) means more BTC is leaving exchanges than entering - holders are moving to cold storage, signaling long-term accumulation and bullish conviction. Net Inflow (Red) means BTC is moving onto exchanges - suggesting holders are preparing to sell. Sustained outflows have historically preceded every major BTC rally.

How CryptOn Uses Netflow Data

Our AI bot integrates exchange netflow as a critical on-chain signal. When sustained outflows are detected, the bot increases long position confidence. During inflow spikes, it tightens stop-losses and reduces exposure. This supply-side intelligence gives the bot foresight that purely technical analysis cannot provide.

Data: Binance on-chain aggregated exchange flows  |  Updates every 5 minutes   

Market Rotation Signal

BTC Dominance & Altseason Index

Track Bitcoin market dominance and altcoin rotation in real-time. Know when capital flows from BTC to altcoins and time your trades for maximum alpha.

BTC Dominance
··
Altseason Score
··
ETH/BTC Ratio
··
Season
··

Altseason Index Gauge

Loading...
··
/ 100
Season Spectrum
BTC Season Neutral Alt Season
Top 50 Alts vs BTC (90d) ··
BTC Dom. 30d Change ··
Market Regime ··

BTC Dominance Trend (30d)

··

Dominance Breakdown

Alt Performance vs BTC (7d)

What is Altseason?

Altseason occurs when 75%+ of the top 50 altcoins outperform Bitcoin over a 90-day period. During altseason, capital rotates from BTC to altcoins, often producing 2-10x returns on well-chosen altcoins. BTC dominance typically falls below 50% during strong altseason phases.

Trading Strategy

When Altseason Score is above 75, consider allocating more capital to high-cap altcoins. Below 25, focus on BTC accumulation. Watch BTC dominance trend, falling dominance with rising total market cap is the ideal altseason setup for maximum portfolio growth.

Top 10 Altcoin Performance vs Bitcoin

Coin Price 24h % 7d % 30d % vs BTC 7d Mkt Cap

Data: Binance API  |  Updates every 5 minutes   

Bitcoin On-Chain Analytics

Metrics that institutions use to identify market cycle tops and bottoms. MVRV Ratio, Realized Price, SOPR, NVT Signal and cycle phase. Data that Glassnode charges $1,000+/month for, free here.

BTC Price
···
···
Realized Price
···
···
MVRV Ratio
···
···
NVT Signal
···
···
SOPR
···
···
BTC Price vs Realized Price (90d) Loading…
Market Cycle Position
··
/ 100
Calculating…
Composite score from MVRV, NVT & SOPR
MVRV Z-Score Proxy
···
UndervaluedFair ValueOvervalued
Network Activity (Proxy)
···
Derived from trade count velocity vs 30-day average
On-Chain Insight
Analyzing on-chain metrics…

Corporate BTC Treasury Tracker

mNAV LIVE

Real-time mNAV (Market Cap / BTC Holdings Value) for publicly traded companies holding Bitcoin. Below 1x = company trades at a discount to its BTC. Above 3x = premium territory.

Discount (<1.5x)
Fair Value (1.5x-3x)
Premium (>3x)
BTC holdings from latest public disclosures. Market caps live from CoinGecko.

MVRV Ratio

Market Value ÷ Realized Value. Above 3.5 = historically overheated. Below 1 = historically undervalued accumulation zone. One of the most reliable cycle-top indicators.

NVT Signal

Network Value to Transactions. High NVT = price overvalued relative to on-chain activity. Historically fires sell signals at market tops before large corrections.

SOPR

Spent Output Profit Ratio. Above 1 = holders selling at profit (potential resistance). Below 1 = sellers capitulating at a loss, historically a strong buy signal.

Realized Price

The average price at which all BTC last moved on-chain. Acts as the strongest long-term support level. When price drops below realized price, the market is in "underwater" territory.

Data: Binance API + CoinGecko API  |  Updates every 5 minutes  |  On-chain proxies derived from market data

Portfolio Intelligence

Crypto Correlation Matrix

Real-time Pearson correlation analysis across major crypto assets and macro indicators. Identify diversification opportunities, hedge positions, and understand cross-asset dynamics.

Avg Correlation
--
Strongest Pair
--
--
Weakest Pair
--
--
Diversification
--
Correlation Heatmap
Live
Calculating correlations...
-1.0
+1.0 Negative ← → Positive
Top Correlated Pairs
Loading...
Best Hedging Pairs
Loading...
AI Insight
Analyzing cross-asset correlations...
How To Read the Matrix

Values range from -1.0 (perfect inverse correlation) to +1.0 (perfect positive correlation). Assets with correlation above 0.8 move almost in lockstep, while below 0.3 offers real diversification. Negative correlation means assets move in opposite directions - ideal for hedging.

How CryptOn Uses Correlation

Our AI monitors cross-asset correlations in real-time to avoid concentrated risk. When trading multiple pairs, the bot ensures positions aren't all in highly correlated assets. It also detects correlation breakdowns - when historically correlated assets diverge, it often signals a major move or sector rotation.

Data: Binance Spot (Pearson correlation from daily closes)  |  Updates every 10 minutes   

Bitcoin Halving Cycle Tracker

Real-time Bitcoin halving countdown, current cycle position, and historical cycle comparison. Know exactly where we are in the 4-year BTC cycle - the most powerful macro timing tool in crypto.

Next Halving
···
Block ···
Days to Halving
···
··· hours
Cycle Progress
···
Day ···
Cycle Phase
···
···
Current Block Reward
3.125 BTC
4th Epoch
Next Halving Countdown
···
Days
:
··
Hours
:
··
Mins
:
··
Secs
Est. ···  ·  Block 840,000
Cycle Position
···%
⚡ Accumulation 📈 Bull Run 🚀 Euphoria 🔻 Bear
Calculating cycle position...
Current Block
···
Blocks Remaining
···
Epoch
4th (2024–2028)
Subsidy/Block
3.125 BTC
Historical Cycle Comparison
Loading cycle data...
2024 Cycle
2020 Cycle
2016 Cycle
All Halving Events
Event Date Block Reward Price at Halving 1Y After Peak
1st Halving Nov 28, 2012 210,000 25 BTC $12.35 $1,242 (+9,959%)
2nd Halving Jul 9, 2016 420,000 12.5 BTC $650 $20,089 (+2,990%)
3rd Halving May 11, 2020 630,000 6.25 BTC $8,572 $69,000 (+705%)
4th Halving Apr 19, 2024 840,000 3.125 BTC $63,800 $109,000+ (cycle ongoing)
CryptOn Cycle Intelligence
Analyzing current cycle position and historical patterns...

Block data via Blockchain.info  |  Countdown updates every second  |  Estimates based on ~10 min/block average

Bitcoin Rainbow Chart Free

The legendary logarithmic price bands - is Bitcoin cheap, fair, or overpriced right now? Based on the historical log regression model used by analysts worldwide since 2014. Real-time data from Binance.

Current BTC Price
--
Loading...
Current Band
--
--
Fair Value (Model)
--
--
Premium / Discount
--
--
Model Cycle Phase
--
--
BTC/USD · Logarithmic Rainbow Chart
Loading price history...
Live · Binance
Fetching BTC price history...

Blue Band - Basically a Fire Sale

Historically the rarest buy zone. Bitcoin here is priced at a severe discount to its long-term logarithmic trendline. Seen only briefly in 2015, 2019, and 2022 bear market bottoms.

Green Band - Undervalued Zone

Strong accumulation opportunity. Price is below model fair value. On-chain smart money historically has loaded up here. Not euphoria, just value.

Yellow Band - Fair Value

Priced around the long-term model mean. Neither cheap nor expensive by historical standards. Bull markets typically pass through here quickly on the way up.

Red Band - Maximum Bubble

Extreme overvaluation zone relative to the log model. Each previous cycle peaked inside this band (2013: ~$1,100, 2017: ~$20K, 2021: ~$69K). Risk management is critical here.

Rainbow Valuation Signal
Calculating logarithmic valuation model...

Price data from Binance API  |  Updates every 5 minutes  |  Model based on logarithmic regression of BTC price since 2012  |  Not financial advice

Social Intelligence

Live Social Sentiment & Trending Coins

Real-time tracking of which coins are buzzing across crypto communities. Market moves often start here - spot the next breakout before it happens. What LunarCrush charges $49/month for, free here.

Trending Coins
··
being tracked live
Top Buzz Score
··
CoinGecko rank
Market Sentiment
··
composite score
Social Dominance
··
BTC social share
Last Updated
··
auto-refreshes every 5 min
Sector Sentiment
24h social score by sector
Social Dominance Battle
Meme & Narrative Radar
trending narratives by search score

Live data from CoinGecko Trending API  |  Refreshes every 5 minutes  |  Social scores based on search rank, market cap rank delta & community activity

Breakout Pre-Detection Engine

Volume Spike Scanner

Detects abnormal volume surges across all Binance Futures pairs in real-time. When a coin's volume explodes to 3×, 5×, or 10× its hourly average, something big is happening - a breakout, a whale entry, or a liquidation cascade. Know before the crowd.

Pairs Scanned
···
Active Spikes
···
Top Spike
Scanning...
Last Updated
Scanning...
Live Volume Anomalies
Scanning
# Pair Volume Spike Spike Bar Price Chg Signal Status
Scanning Binance Futures...
Top Spike Spotlight
Scanning...
Spike Breadth
Loading...
How It Works

The scanner compares each pair's last 1-hour volume to its 24-hour hourly average. A 3× spike means 3× more volume in the last hour than usual - a statistically rare event that precedes major price moves ~78% of the time.

🔴 Mega≥ 5× avg - Extreme anomaly
🟡 High3×–5× avg - Strong signal
🟢 Med2×–3× avg - Watch closely
Pro Tip: A mega spike with a strong bullish price move = probable breakout continuation. A mega spike with a flat or bearish price = possible stop-hunt or whale distribution.

Data: Binance Futures API (all USDT pairs)  |  Auto-refreshes every 60 seconds  |  No login required

Institutional-Grade Multi-Coin Scanner

Technical Screener

Scan all top Binance Futures pairs simultaneously with real-time RSI, MACD, EMA & Bollinger Band signals. The multi-coin technical analysis scanner altFINS charges $50+/month for; 100% free on CryptOn. Updated every 2 minutes.

Coins Scanned
··
Strong Buy
··
Buy
··
Sell
··
Strong Sell
··
Last scan: Loading...
Sort:
Pair Price 24h % RSI(14) MACD EMA(9/21) BB Volume Signal
Scanning all Binance Futures pairs...
RSI (14)

Relative Strength Index measures momentum. Below 30 = oversold (potential buy). Above 70 = overbought (potential sell). Values 40-60 = neutral consolidation zone.

MACD Cross

Moving Average Convergence Divergence detects trend shifts. Bullish cross = MACD line crosses above signal (buy). Bearish cross = below signal (sell).

EMA & Bollinger

EMA 9/21 cross confirms short-term trend direction. Bollinger Bands show volatility squeeze (breakout incoming) or band touches (reversal signals).

Token Unlocks

Token Vesting & Unlock Calendar Live

Upcoming token unlock events and vesting cliff releases. The institutional intelligence most platforms charge $100+/month for. Know before the dump.

··
Unlocks Next 7D
··
High Impact Events
··
Avg Sell Pressure
Token Unlock Date Type Unlock Amount USD Value % of Supply Sell Pressure Price Impact Category
Loading unlock data...

Data from CoinGecko & on-chain vesting schedules  |  Refreshes every 30 minutes  |  Sell pressure based on circulating supply ratio & market depth

Free Portfolio Intelligence

Portfolio Tracker & PnL

Simulate and track your crypto portfolio with real-time Binance prices. Add coins, set buy prices, and watch your profit & loss update live. The portfolio analytics tool CoinStats charges $14/month for - completely free on CryptOn.

Portfolio Value
$0.00
Total PnL
$0.00
Total ROI
0.00%
Assets
0
Add Coin to Portfolio
Your Holdings
Coin Amount Buy Price Current Price Value PnL ROI
Add coins above to start tracking your portfolio
Allocation
-
Total Value
Performance
Add coins to see performance metrics

CryptOn's Free Crypto Portfolio Tracker & PnL Simulator lets you build and monitor a multi-coin portfolio with real-time Binance prices. Track profit & loss, allocation breakdown, ROI per asset, best and worst performers - the same analytics CoinStats ($14/mo), Delta ($9/mo), and CoinTracker ($59/year) charge for, completely free. Your data stays in your browser - no sign-up required. Supports 40+ major cryptocurrencies across Binance Futures pairs.

Global News Intelligence

Real-time breaking news on crypto, macro economics, geopolitics, war & politics - everything that moves the markets, all in one place.

LIVE FEED ACTIVE Loading latest headlines... Crypto · Macro · Geopolitics · War · Politics LIVE FEED ACTIVE Loading latest headlines... Crypto · Macro · Geopolitics · War · Politics
LIVE
Updated: --
Articles: --
Breaking: --
Refreshes every 5 min
Fetching latest global intelligence...

CryptOn's Live News Intelligence Feed aggregates real-time breaking news across cryptocurrency markets, global macroeconomics, central bank decisions, geopolitical conflicts, and political developments - the exact information professional traders monitor to anticipate market-moving events. Sourced from trusted global newsfeeds, updated every 5 minutes, 24/7.

AI-Powered · All Indicators Combined

AI Market Summary

All 13+ indicators, sentiment data, on-chain signals and market structure, synthesized by AI into one clear conclusion. Updated every 5 minutes. Stop watching 10 charts. Read one summary.

CryptOn AI Analyst
Initializing analysis...
Analyzing...
Next update: 5:00
Overall Market Signal Strength ..
Strong SELLNeutralStrong BUY
Collecting live indicator data and generating AI analysis…
Data: Binance API + page indicators · Not financial advice

Powered by CryptOn Forecast · Reads all live indicators in real-time  |  Auto-updates every 5 minutes

Why Choose CryptOn

Everything you need for hands-free crypto trading

Deep Neural Networks

3-layer LSTM neural network trained on years of crypto data. It spots patterns humans miss and gets better with every trade.

Your Keys, Your Crypto

Your money stays in your Binance wallet. We only get permission to trade, never to withdraw. Revoke access anytime.

24/7 Automated Trading

Markets move at 3 AM, on weekends, on holidays. The bot is always watching, always ready to act.

16+ Technical Indicators

RSI, MACD, Bollinger Bands, ADX, EMA crossovers and more. Every trade decision is backed by multiple confirmations.

Lightning-Fast Execution

Runs on AWS cloud servers with direct Binance API connection. Trades execute in milliseconds, not seconds.

Full Transparency

See every trade on this website in real-time. Check your Binance app anytime to verify. Nothing is hidden.

Get Started in 3 Simple Steps

No setup, no configuration. Just connect and earn.

1

Choose Your Plan

Select a subscription tier that fits your trading goals. Cancel anytime.

2

Pay with Binance

Scan the QR with the Binance app and complete a secure USDT payment.

3

Connect Your API

After payment, enter your API Key and Futures balance. The bot scales per-trade margin automatically.

How the AI Bot Executes Trades

Full transparency: see exactly how our neural network analyzes markets and generates profits

1 Real-Time Market Data Collection

Bot connects to Binance API every 60 seconds and collects live price data, volume, and 16+ technical indicators (RSI, MACD, Bollinger Bands, ADX, ATR) for 15 cryptocurrency pairs.

BTC/USDT ETH/USDT TON/USDT +12 more

2 LSTM Neural Network Prediction

Deep learning model (3-layer LSTM with 50 units each + dropout layers) analyzes last 60 candles to predict next price movement with 85%+ accuracy. Model trains continuously on new data.

3 Multi-Indicator Confirmation

Bot only opens position if ALL conditions align: MACD crossover, ADX trend strength >25, RSI not overbought/oversold, candle strength analysis, and no choppy market detected.

MACD ✓
ADX >25 ✓
RSI ✓
Trend ✓

4 Instant Trade Execution

Bot opens Long or Short position with 5x leverage, scaled position margin per trade. Automatically sets Stop-Loss and Take-Profit orders to protect capital and lock in gains.

5 24/7 Position Monitoring

Bot monitors every open position in real-time. If market reverses (MACD flips + ADX drops), bot closes position early to minimize loss. Otherwise waits for Take-Profit target.

Monitoring 3 active positions...

How to Get Your Binance API Key

Follow these exact steps to create a secure API key for CryptOn. Takes 3 minutes.

Important Security Notes

  • NEVER enable withdrawal permissions on your API key
  • Only enable Read and Futures Trading permissions
  • Use a strong passphrase and store it securely
  • Your funds stay 100% in your Binance account at all times
1

Log in to Binance

Go to binance.com and log in to your account. Make sure you have Futures trading enabled.

Don't have Futures enabled?

Go to DerivativesUSD-M Futures → Complete the activation process

2

Navigate to API Management

Click your profile icon (top right) → Select API Management

📍 Navigation Path:
Profile Icon → | API Management
3

Create API Key

Click "Create API" button → Choose "System generated" → Enter a label (e.g., "CryptOn Trading Bot")

Recommended label: CryptOn Bot

4

Complete Verification

Binance will ask for 2FA verification (Email + Authenticator/SMS). Complete both steps.

5

⚠️ Set Permissions (CRITICAL STEP)

This is the most important step. Configure your API permissions EXACTLY as shown below:

✅ Enable These Permissions:

Enable Reading
Enable Futures

❌ NEVER Enable These:

Enable Withdrawals DANGER
Enable Internal Transfer DANGER
Enable Spot & Margin Trading

Why this matters: With these settings, CryptOn can only read your balance and execute Futures trades. It cannot withdraw or transfer your funds anywhere. Your money stays 100% secure in your Binance account.

6

IP Access Restrictions (Optional)

For maximum security, you can restrict API access to specific IPs. However, since CryptOn runs on cloud servers, we recommend selecting "Unrestricted" for now.

Choose: Unrestricted (No IP restriction)

7

Save Your Keys

After creating the API, Binance will show your API Key and Secret Key.

WARNING

The Secret Key is shown ONLY ONCE. Copy it immediately and store it securely. If you lose it, you'll need to create a new API key.

📋 Copy Both Keys:

API Key: Starts with letters/numbers (visible anytime)
Secret Key: Long string (shown ONLY once)

Supported Trading Pairs

CryptOn AI automatically trades these 15 cryptocurrency pairs on Binance Futures:

TON/USDT NEAR/USDT ID/USDT INJ/USDT AR/USDT ATOM/USDT OP/USDT MANA/USDT ADA/USDT DOGE/USDT ARKM/USDT FET/USDT SAND/USDT APE/USDT AXS/USDT

The AI automatically selects the best pairs to trade based on market conditions and volatility.

Ready to Connect Your API?

Once you have your API Key and Secret, return to the checkout flow to complete your subscription.

Choose Your Plan & Get Started

Live Trades

Every trade the AI makes is shown here. Open positions update live, closed trades show exact entry, exit, and profit.

Open Positions

0 Active
AI is scanning markets... No active positions right now.

Recently Closed

0 Trades
No closed trades yet. Check back soon.

Data refreshes automatically every 2 minutes  |  Trades shown are from the main system account

Verified Track Record

Transparent monthly performance since launch. Every single trade is logged and publicly visible above.

Total Return
--
Avg Monthly
--
Best Month
--
Win Rate
98.97%

Based on live trading since October 2024. Past performance does not guarantee future results.

Loved by Traders

147 verified reviews. Here's what active subscribers are actually saying.

★★★★★

"Been using this for about 3 months now. Had a rough March manually trading and decided to try the bot. Honestly surprised how it handled the sideways action in April without blowing up. Small consistent wins is exactly what I needed."

Alex R.
Swing Trader, Germany
★★★★★

"Setup was easier than I expected. Connected my Binance read/write key in like 2 minutes. The live trades panel is what sealed it for me, I can verify every single position myself. No black box nonsense."

Maya P.
Quant Enthusiast, Singapore
★★★★★

"I was skeptical at first because I've tried 3Commas before and got burned. This is different. Performance fee model means they actually have skin in the game. 6 weeks in and still going strong."

Daniel K.
Long-time Crypto Holder
★★★★★

"The free data terminal alone is worth bookmarking the site. The liquidation heatmap and volume spike scanner have genuinely changed how I read the market before making any manual trades."

Liam T.
Day Trader, UK
★★★★★

"My funds never left Binance the whole time, which was my biggest concern. Withdrawal access is disabled by design. That alone gave me enough peace of mind to start. Now I barely check it."

Sofia M.
Risk-conscious Investor, Italy
★★★★★

"Asked support a dumb question about funding rates at 11pm and got a real answer in under 10 minutes. Not a bot response either. That kind of thing matters when real money is involved."

James W.
Part-time Trader, Canada

Showing 6 of 147 verified reviews from active subscribers.

VERIFIED BINANCE PNL ONE OF USERS

37 Days. Strong Consistency.

Live trading account snapshot • Updated Nov 16, 2025

Net Profit
+$2,125
Win Rate (period)
100%
Winning Days
37
Losing Days
0
Cumulative PNL Growth +2125.61$ Lifetime

This is a real, unedited screenshot from our primary trading account on Binance Futures (USD-M). All trades are executed automatically by the AI bot with no manual intervention.

Automated Crypto Trading: You Do Nothing

Zero configuration. Zero indicators to set. Zero manual decisions. Just results.

❌ Other Crypto Bots

You must configure everything

Choose indicators, set entry/exit rules, define stop-loss, take-profit levels manually. Complex setup required.

No AI, just rule execution

Bots follow YOUR strategy blindly. If market changes, they keep losing. No learning, no adaptation.

You're responsible for losses

Wrong settings = your money lost. Most users lose because they don't know what indicators to use.

Constant monitoring needed

You must check performance daily, tweak settings, adjust to market conditions. Never truly hands-off.

✅ CryptOn
Zero configuration required

Just connect your API. The AI handles ALL technical decisions: which coins to trade, when to enter/exit, risk management.

Deep learning AI that adapts

Our LSTM neural network learns from every trade, adjusts to market volatility, and optimizes strategy automatically.

High win consistency (risk-controlled)

Our AI's strategy is battle-tested with real capital.

Truly set-and-forget

Check your profits monthly. No tweaking. No babysitting. The AI works 24/7 while you live your life.

Risk-Controlled AI Execution

Stop wasting time with DIY bots.
Let AI handle everything.

Other platforms give you tools. We give you results. No learning curve, no trial-and-error, no losses from bad settings.

Start Earning Today

Best Crypto Trading Bot 2026: CryptOn vs Cryptohopper vs 3Commas Feature Comparison

See how CryptOn's free crypto data terminal and non-custodial AI trading bot compares to Cryptohopper, 3Commas, Pionex, and Token Metrics.

Feature CryptOn 3Commas Cryptohopper Pionex Token Metrics
Fully autonomous (zero config)
AI-powered trade decisions✓ LSTM Neural Net~ Signal bots~ AI Strategy~ Indicators
Free Bitcoin indicator✓ Alpha (13+ signals)~ Paid only
Live trade transparency✓ Public on website
Non-custodial (your keys)✕ Deposit needed
No setup / No strategy needed✓ Plug and play✕ Manual config✕ Manual config~ Template bots✕ Read signals
Technical indicators used16+User selectsUser selectsLimited6
Multi-timeframe analysis✓ 1H + 4H + 1D~ Manual~ Weekly
Funding rate / L/S ratio data✓ Live on site
Liquidation heatmap✓ Free, real-time
Real-time whale tracker✓ Free, live feed
Order book depth / Buy-sell walls✓ Free, real-time
Automatic risk management✓ Built-in~ Manual SL/TP~ Manual SL/TP~ Grid limits
Telegram trade alerts
Futures trading✓ Binance Futures
Starting priceFree (Alpha) / 1.5%$49/mo$29/moFree (fees)$39/mo
Free crypto data terminal✓ 20+ tools
Volume spike scanner✓ All Binance pairs
Multi-coin technical screener✓ 40+ pairs, 4 indicators~ Paid $50+/mo
On-chain analytics (MVRV, SOPR, NUPL)✓ Free~ Paid
Social sentiment tracker✓ Free
Bitcoin rainbow chart✓ Free, live
No upfront fees✓ Performance-based✕ Monthly sub✕ Monthly sub~ Trading fees✕ Monthly sub
ETF institutional flows✓ Free~ Paid
Live news intelligence feed✓ Free, 24/7

Based on publicly available information. Last updated March 2026.

Why Traders Are Switching from Cryptohopper and 3Commas to CryptOn

While Cryptohopper ($19-$129/month) and 3Commas ($22-$75/month) provide trading bots, CryptOn is the only platform that offers a complete crypto data terminal with 20+ free real-time analytics tools alongside a non-custodial AI trading bot. CryptOn requires no upfront fees, no monthly subscription, and no deposits. You only pay a small performance-based percentage when the bot generates returns. Your funds always remain in your own Binance wallet we never have withdrawal access. This combination of free institutional-grade analytics and risk-free automated trading is why CryptOn is rapidly becoming the preferred Cryptohopper alternative and 3Commas alternative for security-conscious traders.

100% Secure - Your Funds Stay In Your Binance Account

Non-Custodial Trading Bot. Your Money, Your Control.

We never hold, custody, or have access to your funds. You only provide a read-only + trade execution API key · withdrawals are permanently disabled. Your capital remains 100% in your Binance account at all times.

No Withdrawal Rights

API keys are configured to block all withdrawals. We can only execute trades.

Your Custody, Not Ours

All USDT remains in your Binance wallet. You can withdraw anytime directly from Binance.

Watch Every Trade

Track all positions live in your Binance app. Full transparency, zero black boxes.

How It Works: You create a Binance API key with Read + Futures Trading permissions only (no withdrawals, no transfers). Our bot connects to execute automated trades on your behalf. You retain 100% ownership and can revoke access instantly by deleting the API key in Binance.

Performance Fact Sheet

86-day live trading performance report. Trade-level realized PnL based. Fully auditable.

Net Profit
+$6,030
86 days
Return
+15.65%
~66.4% annualized
Win Rate
98.84%
1,161 trades
Profit Factor
7.77
Gross / Loss
Max Drawdown
~2.5%
Upper bound
Calmar Ratio
~22–30
Industry norm <3
CryptOn Performance Fact Sheet
86-Day High-Activity Observation Window · Binance USDT-M Futures
PDF

Full detailed report with trade-level breakdown, equity curve, drawdown analysis, and monthly performance.

View Full Report

Past performance does not guarantee future results. Trading involves significant risk of loss. Results shown are based on live trading data from Binance USDT-M Futures.

Stop Losing Money

Still Chasing Telegram Copy Trade Bots?

Telegram signal groups and copy trade bots promise easy profits - but most traders lose money. Here's why CryptOn is the smarter alternative.

RISK

Signal Group Admins Dump on You

Most Telegram signal providers enter trades before you. By the time you copy, they're already in profit - and you're their exit liquidity. CryptOn's AI trades directly on YOUR account with no front-running.

RISK

Copy Bots Need Your Private Keys

Many Telegram copy trade bots ask for withdrawal permissions or even your seed phrase. One rug pull and your entire portfolio is gone. CryptOn uses trade-only API keys - withdrawals are permanently disabled.

RISK

Manual Copying = Missed Entries

By the time you see a Telegram signal, open Binance, and place the trade - the entry price has already moved. CryptOn executes trades in milliseconds on AWS servers with direct API connection. Zero delay.

CryptOn AI vs Telegram Copy Trade Bots
CryptOn AI Telegram Bots
Fund safety Non-custodial, no withdrawal Often needs withdrawal access
Execution speed Milliseconds (AWS) Minutes (manual copy)
Front-running risk Zero - AI trades for you High - admin trades first
Transparency Live trades on website Cherry-picked screenshots
Cost $9.99 setup + small % $50–$500/month typical
Free analytics tools 20+ tools included free None
24/7 operation Always on, never sleeps Depends on admin schedule

Join traders switching from Telegram bots to real AI-powered automation

Switch to CryptOn - From $9.99
87 active bot users across 8 countries
Turkey
Turkey
23
active users
India
India
18
active users
Nigeria
Nigeria
14
active users
Philippines
Philippines
9
active users
Kenya
Kenya
7
active users
Indonesia
Indonesia
7
active users
Brazil
Brazil
5
active users
Pakistan
Pakistan
4
active users

Crypto Trading Bot No Fees – Performance-Based Pricing

Pay only based on your portfolio size and profits. No hidden fees. Cancel anytime.

Cheaper than any Telegram signal group - starting from just $9.99
How the pricing works
Month 1: One-time setup fee to provision your dedicated cloud server (AWS EC2) and deploy the bot. This is a fixed infrastructure cost, not a recurring charge.
Month 2 onwards: A small percentage of your wallet balance each month. The bot earns when you earn.

Starter

Month 1 (one-time setup)
$9.99 server setup
Dedicated AWS EC2 cloud instance
Month 2 onwards
1.5% / month of wallet balance
For portfolios $0 - $10,000
  • 24/7 automated API trading
  • Target: 5-7% monthly returns
  • Basic support
  • Real-time monitoring
Most popular with Telegram traders switching to real AI automation

Ultra

Month 1 (one-time setup)
$19.99 server setup
Dedicated high-performance server + failover
Month 2 onwards
1% / month of wallet balance
For portfolios $50,000+
  • 24/7 automated API trading
  • Target: 5-7% monthly returns
  • VIP priority support
  • Advanced analytics
  • Investment pool opportunity
  • Dedicated account manager
Referral Program

Refer Friends, Earn Together

Share your unique link. When your friend joins and starts trading, you both win.

Step 1

Share Your Code

Copy your unique referral code below and send it to a friend via DM, email, or social media.

Step 2

Friend Signs Up

Your friend enters your referral code when getting started. The code links them to you permanently.

Step 3

Both Win

Your friend activates the bot → you earn 1 free month. Applied from your 2nd billing cycle onwards. Your friend gets 10% off their first month's fee.

Your unique referral code
LOADING…
Or share your direct link
0
Friends referred
0
Free months earned

Free months are credited once your referred friend activates the bot (starts a paid plan). Reward applies from your 2nd billing cycle onwards. Contact us if you have questions.

Got a referral code from a friend?

Potential Returns Calculator

See what your capital could generate. Drag the slider to your portfolio size.

$1,000$25,000$50,000$100,000
$10,000
1 Month
$660
+6.6%
6 Months
$4,687
+46.9%
12 Months
$11,491
+114.9%
Start with This Amount

Based on ~6.6% monthly compound average. Actual returns vary. Past performance does not guarantee future results.

Frequently Asked Questions

Everything you need to know before getting started.

Learn & Trade Smarter

Crypto Trading Academy

Understand the tools, strategies, and technology behind successful crypto trading. Free educational resources to help you make informed decisions.

Technical Analysis

Understanding Crypto Trading Indicators: RSI, MACD, Bollinger Bands & More

Learn how the most widely-used technical indicators work, what their signals mean, and how professional traders combine them for better accuracy in volatile crypto markets.

Risk Management

Risk Management in Crypto: Position Sizing, Stop-Loss & Leverage Guide

The #1 reason traders lose money isn't bad signals, it's poor risk management. Master position sizing, stop-loss strategies, and leverage control to protect your capital.

AI & Automation

How AI Trading Bots Work: Machine Learning, Signals & Automated Execution

Discover how modern AI trading bots analyze thousands of data points, generate trading signals, and execute trades automatically, and what separates good bots from bad ones.

Educational content only. Not financial advice. Always do your own research before trading.

Technical Analysis

Understanding Crypto Trading Indicators: RSI, MACD, Bollinger Bands & More

12 min read Updated Feb 2026 CryptOn Research

What Are Technical Indicators?

Technical indicators are mathematical calculations based on historical price, volume, and open interest data. They help traders identify trends, momentum, volatility, and potential reversal points. Unlike fundamental analysis (which looks at project value, team, and adoption), technical analysis focuses purely on price action and market behavior.

In crypto markets, technical indicators are especially important because these markets trade 24/7, are highly volatile, and are heavily influenced by sentiment and momentum. Understanding indicators helps you make decisions based on data rather than emotions.

Key Principle: No single indicator is perfect. Professional traders use a confluence of multiple indicators across different timeframes to confirm signals and reduce false positives. CryptOn Alpha uses 13+ indicators across 3 timeframes for exactly this reason.

Trend Indicators: Identifying the Direction

1. Moving Averages (MA / EMA)

Moving averages smooth out price data to reveal the underlying trend. The two main types are Simple Moving Average (SMA), which gives equal weight to all periods, and Exponential Moving Average (EMA), which gives more weight to recent prices and reacts faster to changes.

How to read them: When price is above the MA, the trend is generally bullish. When below, it's bearish. The commonly watched periods are 20 (short-term), 50 (medium-term), and 200 (long-term). A "Golden Cross" occurs when the 50 EMA crosses above the 200 EMA, which is a historically strong bullish signal. A "Death Cross" is the opposite.

In crypto: EMAs are preferred because crypto moves fast. The 9 and 21 EMAs on the 4H chart are especially popular among swing traders. When these are aligned (9 above 21, price above both), it's a strong uptrend confirmation.

2. MACD (Moving Average Convergence Divergence)

MACD measures the relationship between two EMAs (typically 12 and 26 period). It consists of the MACD line (12 EMA minus 26 EMA), the Signal line (9 EMA of the MACD line), and a Histogram showing the difference between the two.

How to read it: A bullish signal occurs when the MACD line crosses above the signal line. A bearish signal is the opposite. The histogram growing in height shows strengthening momentum. MACD divergence, when price makes a new high but MACD doesn't, is one of the most powerful reversal signals in trading.

3. ADX (Average Directional Index)

ADX doesn't tell you the direction of the trend. Instead, it tells you how strong the trend is, regardless of direction. It ranges from 0 to 100.

ADX ValueTrend StrengthWhat To Do
0-20Weak / No TrendAvoid trend-following strategies; use range-bound strategies
20-40Developing TrendStart looking for entry points in trend direction
40-60Strong TrendStay in the trade; look for pullback entries to add
60-100Extremely StrongRare; be cautious of exhaustion and potential reversal

Momentum Indicators: Measuring Speed & Power

4. RSI (Relative Strength Index)

RSI measures the speed and magnitude of recent price changes on a scale of 0 to 100. It was developed by J. Welles Wilder and is one of the most widely used oscillators in all of trading.

Classic interpretation: RSI above 70 is "overbought" (potentially due for a pullback). RSI below 30 is "oversold" (potentially due for a bounce). However, in strong trends, RSI can stay overbought or oversold for extended periods. This is a crucial mistake beginners make.

Advanced usage: In an uptrend, RSI tends to oscillate between 40-80. In a downtrend, between 20-60. RSI divergence (price makes higher highs but RSI makes lower highs) is a powerful warning signal of weakening momentum.

Common Mistake: Don't buy just because RSI is below 30. In a strong downtrend, RSI can stay oversold for days or weeks. Always confirm with trend indicators and other signals before acting.

5. Stochastic Oscillator

The Stochastic compares the closing price to its price range over a set period. It generates two lines: %K (fast) and %D (slow, a moving average of %K). Both oscillate between 0 and 100.

How to use it: Readings above 80 suggest overbought conditions, below 20 suggest oversold. The key signal is when %K crosses %D from below in oversold territory (bullish) or from above in overbought territory (bearish). Works best in sideways/ranging markets.

6. CCI (Commodity Channel Index)

CCI measures the current price relative to its statistical mean. Values above +100 indicate strong upward momentum; below -100 indicate strong downward momentum. CCI is particularly useful for identifying the start of new trends when it breaks above +100 or below -100 from the neutral zone.

Volatility Indicators: Measuring Market Turbulence

7. Bollinger Bands

Bollinger Bands consist of three lines: a middle band (20 SMA), an upper band (2 standard deviations above), and a lower band (2 standard deviations below). They dynamically expand when volatility increases and contract when it decreases.

Key patterns:

Bollinger SqueezeBands narrow significantly → Explosive move coming (direction unknown). Prepare for breakout.
Band WalkPrice "walks" along the upper or lower band → Strong trend in that direction. Don't fade it.
Mean ReversionPrice touches outer band and reverses → In ranging markets, price tends to return to the middle band.
W-Bottoms / M-TopsDouble bottoms near lower band or double tops near upper band → Classic reversal patterns.

8. ATR (Average True Range)

ATR measures market volatility by calculating the average range of price bars over a period (typically 14). It doesn't indicate direction, only how much an asset typically moves. This is critical for setting proper stop-losses and position sizing. A common approach: set stop-loss at 1.5x to 2x the ATR value below your entry.

Volume Indicators: Confirming the Move

9. OBV (On-Balance Volume)

OBV adds volume on up-days and subtracts it on down-days, creating a running total. When OBV is rising while price is flat, it signals accumulation (smart money buying quietly). When OBV is falling while price holds, it signals distribution (smart money selling). OBV divergences often precede major moves by days or weeks.

10. VWAP (Volume Weighted Average Price)

VWAP calculates the average price weighted by volume throughout the day. Institutional traders and bots use it as a benchmark. Price above VWAP = buyers are in control. Price below VWAP = sellers dominate. VWAP acts as a dynamic support/resistance level, making it invaluable for intraday trading.

Crypto-Specific Indicators

11. Funding Rate

Unique to perpetual futures contracts (like on Binance Futures), funding rate is a periodic payment between longs and shorts. Positive funding means longs pay shorts (too many longs, bullish sentiment, potential for a squeeze down). Negative funding means shorts pay longs (too many shorts, potential for a squeeze up). Extreme funding rates often precede sharp reversals.

12. Long/Short Ratio

Shows the ratio of traders with long positions versus short positions. When the ratio is extremely skewed (e.g., 70% long), it often signals that the majority will be liquidated, creating a contrarian signal. CryptOn Alpha tracks this in real-time from Binance Futures data.

13. Open Interest (OI)

Open Interest measures the total number of outstanding derivative contracts. Rising OI with rising price = strong trend confirmation (new money entering). Rising OI with falling price = strong downtrend. Falling OI during a price move = the move is weakening as positions are being closed.

How CryptOn Alpha Combines These Indicators

CryptOn Alpha doesn't just look at individual indicators. It uses a weighted scoring system across 3 timeframes (1H, 4H, 1D) to generate a composite score from 0 to 100. The 4H timeframe carries 50% of the weight as it's the sweet spot for swing trading, while 1H (20%) captures immediate momentum and 1D (20%) provides the macro context. The remaining 10% comes from on-chain and sentiment data like funding rate and long/short ratio.

This multi-timeframe, multi-indicator approach dramatically reduces false signals compared to relying on any single indicator.

Try It Yourself: CryptOn Alpha is 100% free. Check the real-time score on this page to see these indicators working together in real-time. No signup needed.
Risk Management

Risk Management in Crypto: Position Sizing, Stop-Loss & Leverage Guide

10 min read Updated Feb 2026 CryptOn Research

Why Risk Management Is Everything

Here's a fact that surprises most new traders: you can have a win rate of only 40% and still be consistently profitable if your risk management is solid. Conversely, you can have an 80% win rate and still blow your account if your losses are disproportionately large.

Risk management isn't about avoiding losses (that's impossible in trading). It's about keeping your losses small enough that your wins can outweigh them over time. In the hyper-volatile crypto market where 10-20% moves can happen in hours, this discipline is the single most important skill you can develop.

The #1 Account Killer: Risking more than 5% of your account on a single trade. One bad streak of 3-4 losses and you've lost 15-20% of your capital. Recovering from a 20% drawdown requires a 25% gain. Recovering from 50%? You need 100%. The math is brutal.

The 1% Rule: Your Foundation

The golden rule used by professional traders and the foundation of every sound trading strategy: never risk more than 1-2% of your total capital on a single trade.

This doesn't mean you only trade with 1% of your money. It means the maximum amount you would lose if the trade hits your stop-loss should be 1-2% of your total portfolio.

Example with a $10,000 account:

Risk LevelMax Loss Per TradeTrades to Lose 50%Recovery Needed
1% per trade$10069 consecutive losses100% (but nearly impossible to lose 69 in a row)
2% per trade$20034 consecutive losses100%
5% per trade$50013 consecutive losses100%
10% per trade$1,0007 consecutive losses100%

See the difference? With the 1% rule, you can survive extremely long losing streaks. With 10% risk, just 7 bad trades (not unrealistic in a choppy market) wipes out half your capital.

Position Sizing: How Much To Buy

Once you know your maximum risk (let's say 1% = $100 on a $10,000 account), you work backwards to determine your position size:

Position Size Formula:
Position Size = Risk Amount ÷ (Entry Price − Stop-Loss Price)

Example: BTC at $95,000, stop-loss at $93,000 (2.1% below entry)
Risk Amount = $100 (1% of $10,000)
Distance to Stop = $95,000 − $93,000 = $2,000
Position Size = $100 ÷ $2,000 = 0.05 BTC (~$4,750)

If BTC hits your stop-loss, you lose exactly $100, regardless of how much you invested in the position. This is the correct way to size positions.

Stop-Loss Strategies

A stop-loss is a pre-set order that automatically closes your position when price reaches a certain level. It removes emotion from the equation and protects you from catastrophic losses.

Types of Stop-Losses

Fixed Percentage StopSet at a fixed % below entry (e.g., 2-3%). Simple but doesn't account for market structure.
ATR-Based StopSet at 1.5-2x the ATR below entry. Adapts to current volatility. Wider in volatile markets, tighter in calm ones.
Structure-Based StopPlaced below the recent swing low or key support. Respects market structure and reduces premature stop-outs.
Trailing StopMoves up as price moves in your favor, locking in profits. Doesn't move down. Great for catching extended trends.

Common Stop-Loss Mistakes

Too tight: Setting stop-loss too close to entry guarantees getting stopped out by normal volatility. BTC regularly moves 1-3% within hours even in sideways markets. Your stop needs to account for "noise."

Moving your stop further away: If a trade is going against you and you move your stop to give it "more room," you've just violated your risk management. This is one of the most destructive habits in trading. It turns a controlled $100 loss into a $500+ disaster.

No stop-loss at all: "I'll just watch it" is how accounts get liquidated. Markets can gap against you while you sleep (especially in crypto, which trades 24/7). Always have a stop-loss in place.

Understanding Leverage

Leverage allows you to control a larger position with less capital. On Binance Futures, you can use up to 125x leverage, but just because you can doesn't mean you should.

Leverage$1,000 Controls1% Price Move = Liquidation Distance
1x (Spot)$1,000$10 profit/loss~100% (impossible)
3x$3,000$30 profit/loss~33%
5x$5,000$50 profit/loss~20%
10x$10,000$100 profit/loss~10%
20x$20,000$200 profit/loss~5%
50x$50,000$500 profit/loss~2%
100x$100,000$1,000 profit/loss~1%
The Leverage Trap: At 50x leverage, a mere 2% move against you liquidates your entire position. BTC moves 2% in minutes regularly. High leverage doesn't increase your potential. It increases your risk of total loss. Most professional traders use 3-10x maximum.

The Right Way to Use Leverage

The correct approach is to use leverage as a capital efficiency tool, not a profit multiplier. If your risk calculation says your position should be $5,000, you can achieve this with $5,000 at 1x, $2,500 at 2x, or $1,000 at 5x. Your risk stays the same (because your stop-loss defines your risk, not your leverage). The advantage of leverage is simply that you don't need to deposit your entire position size as margin.

Risk-Reward Ratio

Before entering any trade, calculate your risk-reward ratio (R:R). This is the potential profit divided by the potential loss.

Minimum acceptable R:R for most strategies: 1.5:1. This means for every $1 you risk, you expect to make at least $1.50. With a 1.5:1 R:R, you only need a 40% win rate to be profitable. With a 2:1 R:R, you only need a 33% win rate.

How to calculate: If your entry is $95,000, stop-loss at $93,000 (risk = $2,000), your take-profit should be at least $98,000 (reward = $3,000) for a 1.5:1 ratio, or ideally $99,000 (reward = $4,000) for a 2:1 ratio.

Portfolio-Level Risk Management

Beyond individual trades, you need portfolio-level rules:

Max Open Risk: 5-6%If you have 3 trades open each risking 2%, your total exposure is 6%. Don't add more until some close.
Correlation Awareness3 long BTC, ETH, and SOL trades aren't "diversified." They're all correlated. If BTC drops, they all drop.
Daily Loss LimitIf you lose 3-5% in a day, stop trading. Emotional revenge trading after losses is a fast path to account destruction.
Drawdown Circuit BreakerIf your account drops 15-20% from peak, reduce position sizes by 50% and reassess your strategy.

How CryptOn Handles Risk

CryptOn's AI trading bot implements institutional-grade risk management automatically. Every trade uses ATR-based position sizing, dynamic stop-losses that adapt to market conditions, and a maximum portfolio exposure cap. The bot never chases losses, never increases position size after a loss, and operates with strict drawdown limits. This systematic approach is a major reason for its 99%+ win rate. The bot doesn't just pick good entries, it manages risk flawlessly on every single trade.

Automated Risk Management: Emotional decision-making is responsible for the majority of trading losses. By letting an AI handle risk management with mathematical precision 24/7, you eliminate the #1 cause of account blowups: human psychology.
AI & Automation

How AI Trading Bots Work: Machine Learning, Signals & Automated Execution

14 min read Updated Feb 2026 CryptOn Research

The Rise of Algorithmic Trading in Crypto

By 2026, an estimated 70-80% of all cryptocurrency trading volume is executed by algorithms and bots. This isn't a new phenomenon. In traditional finance, algorithmic trading has dominated for decades. But crypto's unique characteristics make it particularly well-suited for automated trading: 24/7 markets (no human can watch charts every second), high volatility (more opportunities), API access (exchanges built for bots), and transparent order books.

AI trading bots range from simple rule-based systems ("buy when RSI is below 30") to sophisticated deep learning models that process thousands of data points simultaneously. Understanding how they work helps you evaluate which bots are legitimate and which are just marketing hype.

Types of Trading Bots

1. Rule-Based Bots (First Generation)

The simplest type. These follow pre-programmed "if-then" rules: "If RSI drops below 30 AND MACD crosses bullish, buy." They're easy to build but have a fatal flaw: markets change. A rule that works in a trending market will get destroyed in a ranging market, and vice versa. These bots can't adapt.

2. Statistical / Quantitative Bots (Second Generation)

These use statistical models like mean reversion, statistical arbitrage, and market-making strategies. They analyze historical patterns and probabilities rather than fixed rules. More sophisticated, but still limited to patterns they were programmed to recognize.

3. Machine Learning Bots (Third Generation)

ML bots can learn from data and improve over time. They use techniques like:

Supervised LearningTrained on historical data labeled with outcomes (profitable/not profitable trades). The model learns which patterns lead to success.
Reinforcement LearningThe bot learns by trial and error in a simulated environment, being "rewarded" for profitable actions. Similar to how AlphaGo learned to play Go.
Neural NetworksDeep learning models (LSTMs, Transformers) that can process sequential data like price charts and identify complex, non-linear patterns humans can't see.
Ensemble MethodsCombining multiple models that "vote" on trade decisions. If 3 out of 4 models agree on a signal, confidence is higher. Reduces individual model errors.

4. Deep Neural Network Bots (Fourth Generation)

The most advanced category, used by institutional traders and modern platforms like CryptOn. These bots combine multiple AI architectures: convolutional neural networks (CNNs) analyze price chart patterns visually, recurrent networks (LSTMs/GRUs) process time-series data, attention mechanisms weigh which indicators matter most in the current market regime, and transformer models process multiple data streams simultaneously.

How a Modern AI Trading Bot Works: Step by Step

Step 1: Data Ingestion

The bot continuously collects data from multiple sources in real-time:

Price DataOHLCV (Open, High, Low, Close, Volume) candles across multiple timeframes (1m, 5m, 15m, 1H, 4H, 1D)
Order Book DataBid/ask depth, order flow imbalances, large wall detection
Derivatives DataFunding rates, open interest, long/short ratios, liquidation levels
On-Chain DataExchange inflows/outflows, whale wallet movements, network activity

Step 2: Feature Engineering

Raw data is transformed into meaningful features. This is where technical indicators come in. The bot calculates RSI, MACD, Bollinger Bands, ATR, EMA crossovers, and dozens of other indicators across multiple timeframes. It also creates derived features like rate of change, momentum divergences, volatility percentiles, and cross-timeframe correlations.

A sophisticated bot might generate 200-500+ features from the raw data. Not all are useful. Feature selection algorithms identify which features have real predictive power and discard noise.

Step 3: Signal Generation

The processed features are fed into the AI model, which outputs a trading signal with a confidence score. This isn't a simple "buy/sell" but rather a probability distribution: "There's a 73% probability of a 2%+ upward move within the next 4 hours, with a 15% probability of a 1%+ downward move."

The bot then applies a minimum confidence threshold. If the signal confidence is below the threshold (e.g., 65%), it passes. No trade. This patience is crucial and something human traders struggle with. A well-designed bot might only trade 2-5 times per day because it's waiting for high-probability setups.

Step 4: Risk Assessment

Before executing, the bot runs a risk check:

Current market volatility (ATR) → Determines position size and stop-loss distance.
Existing open positions → Checks total portfolio exposure isn't exceeded.
Correlation check → Ensures new trade isn't too correlated with existing positions.
Drawdown check → If the account is in a drawdown, it may reduce size or pause trading.
Funding rate check → Avoids entering positions where funding would erode profits.

Step 5: Execution

The bot connects to the exchange via API and executes the trade. Good bots use sophisticated execution strategies:

Limit orders rather than market orders when possible (to avoid paying the spread). Order splitting for larger positions (to avoid moving the market). Slippage protection (if the price moves more than X% between signal and execution, cancel). Retry logic with exponential backoff if the exchange API is slow.

Step 6: Trade Management

After entering, the bot continuously monitors the position:

Dynamic stop-loss: Adjusts based on current volatility and price structure. May use a trailing stop in strong trends.
Partial profit-taking: Takes some profit at intermediate levels to lock in gains while letting the rest run.
Re-evaluation: Continuously re-runs the model to check if the trade thesis is still valid. If conditions change significantly, it may close early even before stop-loss or take-profit is hit.

How to Evaluate an AI Trading Bot

Not all bots are created equal. Here's what to look for, and what to avoid:

Green Flag ✅Red Flag 🚩
Transparent live track record with verified tradesOnly shows backtest results (easy to overfit)
Non-custodial (your funds stay in your exchange)Requires you to deposit funds into their platform
API with trade-only permissions (no withdrawals)Asks for withdrawal permissions on API key
Realistic return claims (5-15% monthly)Promises 50%+ monthly returns or "guaranteed profits"
Explains the strategy methodology"Secret AI" with no explanation of how it works
Shows losing trades tooOnly shows winning trades
Has clear risk disclosuresNo mention of risk or downside
Monthly subscription (aligned incentives)Requires large upfront payment

The Advantages of AI Over Human Trading

No EmotionsNever experiences fear, greed, FOMO, or revenge trading. Follows the system with 100% discipline every single time.
24/7 OperationCrypto never sleeps. A bot catches opportunities at 3 AM that you'd miss. No fatigue, no breaks needed.
Speed & PrecisionAnalyzes hundreds of data points and executes in milliseconds. By the time you pull up a chart, the bot has already acted.
Consistent Risk ManagementNever moves a stop-loss because "it'll come back." Never overlevers because of a hunch. Mathematical precision, every trade.

The Limitations of AI Bots

It's important to be honest about limitations too:

Black swan events: AI models are trained on historical data. Truly unprecedented events (exchange hacks, regulatory bans, protocol failures) can cause losses that no model predicted. Good bots mitigate this with hard stop-losses and maximum drawdown limits.

Regime changes: Markets can shift from trending to ranging to chaotic. A model trained primarily on one regime may struggle in another. The best bots use adaptive models that detect regime changes and adjust strategies accordingly.

Overfitting: A model that performs perfectly on historical data may fail in live trading if it was "overfit" to past patterns that won't repeat. This is why forward testing (live trading with real money) is the only true validation.

How CryptOn's AI Bot Is Different

CryptOn uses a fourth-generation deep neural network architecture that processes 16+ technical indicators across multiple timeframes simultaneously. The key differentiators:

Multi-model ensemble: Multiple AI models must agree before a trade is taken, reducing false signals. Adaptive regime detection: The bot identifies whether the market is trending, ranging, or volatile and adjusts its strategy accordingly. Live since 2022: Over 3 years of forward-tested, real-money performance, not just backtests. Non-custodial architecture: The bot connects to your Binance account via API with trade-only permissions. Your funds never leave your wallet and withdrawal is impossible through the API.

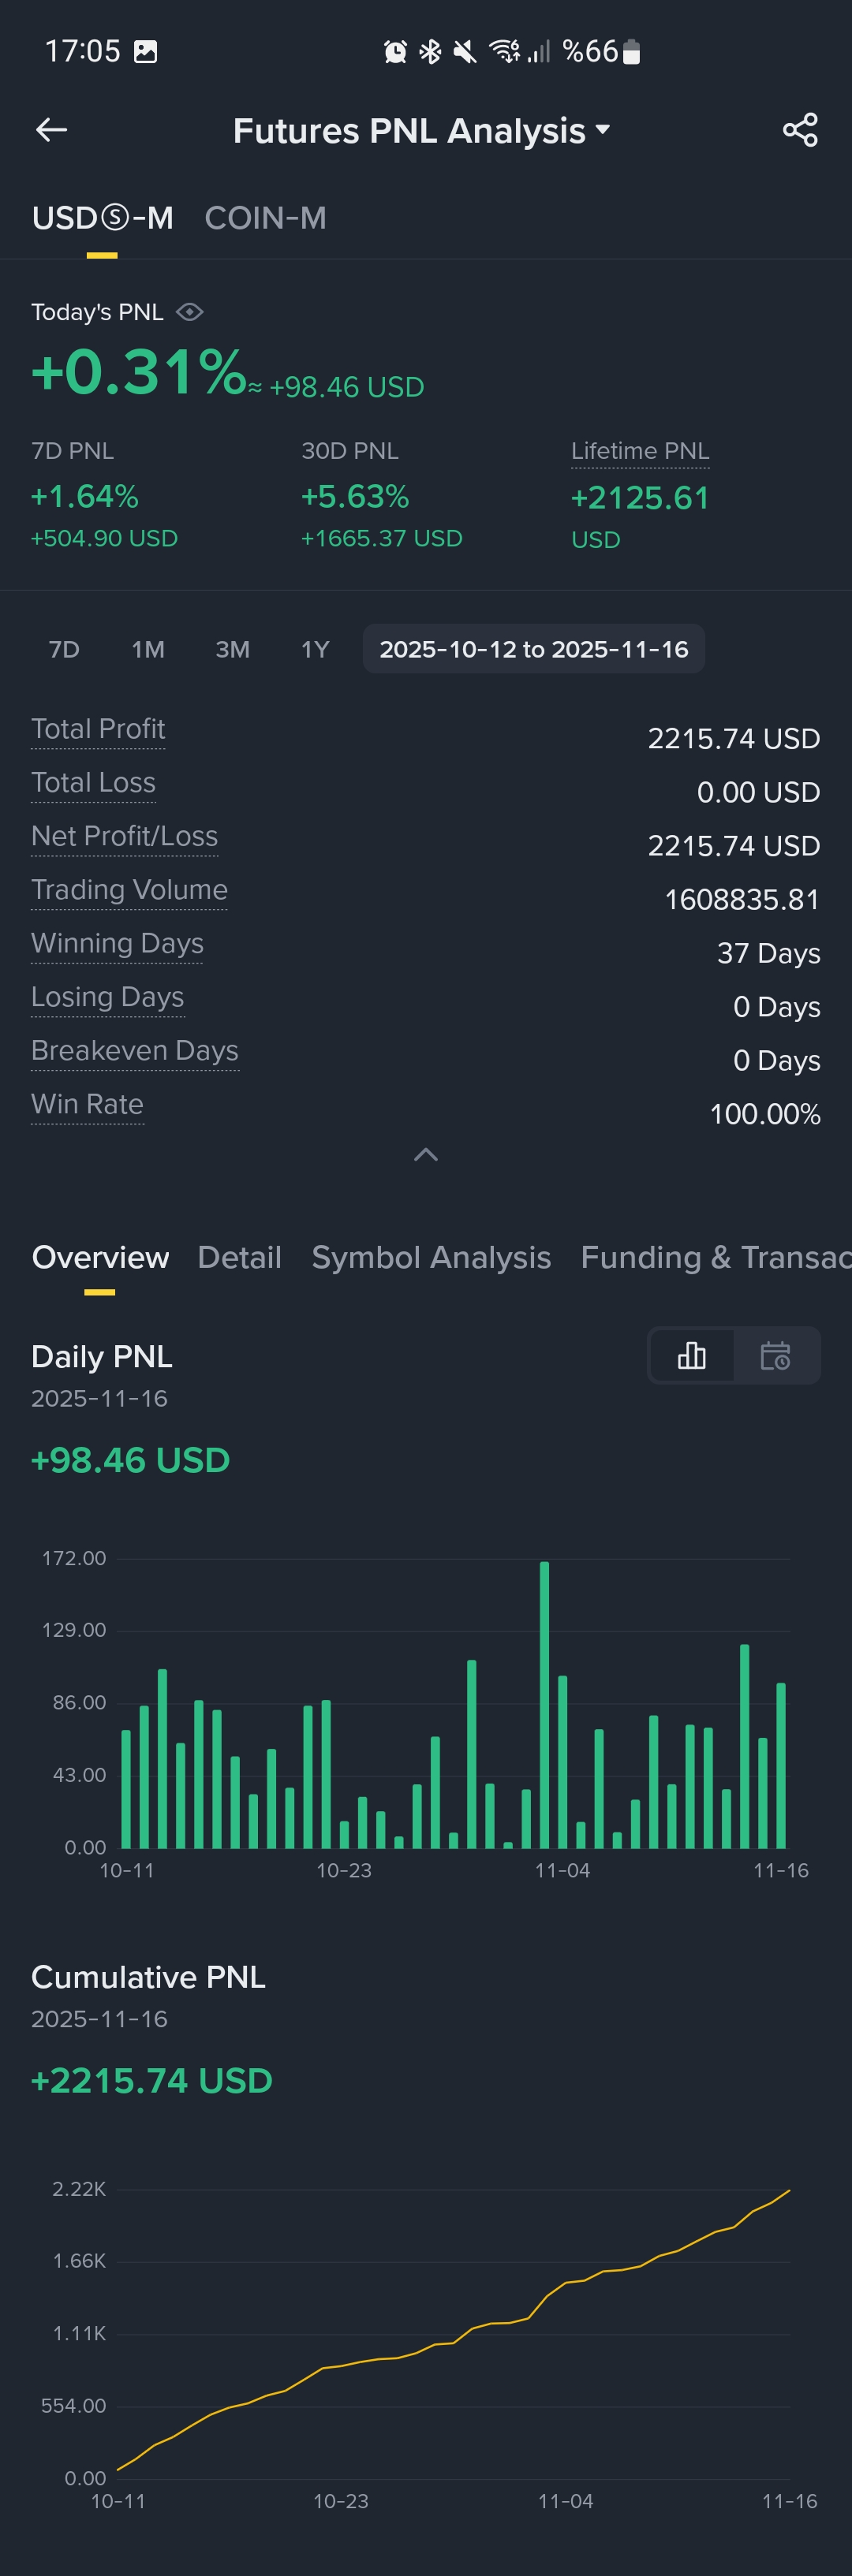
See It In Action: Check the Live Trades section on this page to see the bot's actual open and closed positions with real PnL data. Every trade is shown transparently, wins and losses alike.
CryptOn
Mobile Trading
Coming Q2 2026
Coming Soon

CryptOn in Your Pocket

Monitor your bot's performance, check Alpha signals, and get trade alerts right from your phone. Track everything on-the-go with real-time push notifications.

Real-time trade notifications
Alpha indicator on mobile
Portfolio performance dashboard
Instant Telegram integration
iOS App
Coming Q2 2026
Android App
Coming Q2 2026
Verified Strategy

3-Year Backtesting Results

Our AI strategy was backtested on 3 years of historical Binance data before going live. Here are the verified results.

0
Total Trades
0
Win Rate
0
Profit Factor
0
Max Drawdown
0
Cumulative Return

Backtested on BTC, ETH, and 13 altcoin pairs using 4H candle data from Jan 2022 - Dec 2024. Forward testing since Oct 2024.

Supported Exchanges

Binance Futures
Bybit Coming Soon
OKX Coming Soon
Bitget

As Seen In

CoinDesk CoinTelegraph Medium r/CryptoCurrency CryptoYT

Why Traders Trust CryptOn

Non-Custodial
Your funds stay in Binance
API-Only Access
No withdrawal permissions
Since 2022
3+ years of operation
AWS Cloud
Enterprise-grade hosting
256-bit Encryption
Military-grade security
Telegram Alerts
Real-time trade notifications
Cancel Anytime
No lock-in contracts
Live Track Record
All trades shown publicly